|
Note that Sharenet Support doesn't offer any advice or explanation in regard to Technical Analysis. We do however highly recommend the following book.
Technical Analysis from A to Z
This revised edition provides a basic overview of technical analysis for readers who are new to the subject, explaining what technical analysis with regard to trading actually entails.
It presents 102 technical indicators with detailed explanations and how to go about using them.
Details
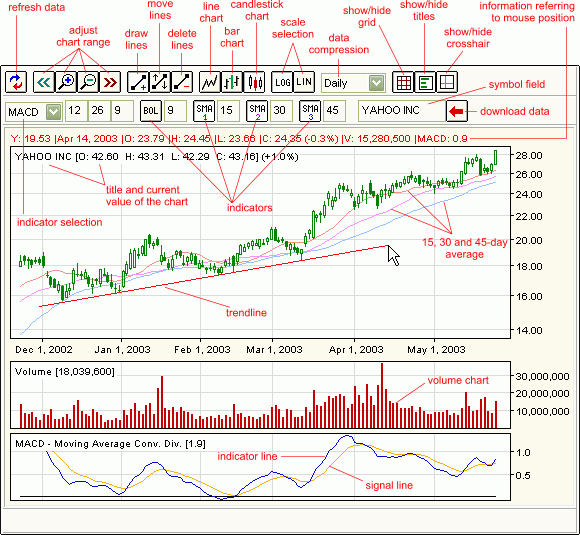
- Displaying charts
To display a given chart enter a share code or name into the symbol field and
press [ENTER] key.
- Working with indicators
To display technical indicators select them using options available
in the second toolbar. Indicator parameters can
be adjusted using text fields to the right of an indicator. Enter
desired parameter value and press [ENTER] key, to apply the new
parameter.
- Chart customization
Using the options available in the first toolbar, you can set a chart type,
a scale, data compression or adjust the amount of data displayed.
- Working with trend lines and formations
You can draw lines on the chart using a mouse. Press the left mouse
button and drag the mouse to draw a line. To move or delete existing
lines, first click on the "move lines" or "delete
lines" button, and then use the mouse.
The following indicators are available
These descriptions are only a guide to provide some insight into their use. We recommend further study, such as the book we recommend at the top of this page.
- Accumulation Distribution (AD)
Variation of OBV, assess the cumulative flow of money into and out of a security by relating volumes and price movements.
- Bollinger Band (BOL)
bands are wide when prices are volatile
- Chaikin Oscillator (ChO)
Moving average oscillator based on the Accumulation/Distribution indicator.
- Commodity Channel Index (CCI)
Measures the change of a security's price from its statistical mean.
- Moving Average Convergence Divergence (MACD)
relationship between 26 day and 12 day exponential moving average (EMA) with a 9 day EMA plotted on top of it as a trigger line to show potential buy/sell opportunities. Sell when MACD falls bellow trigger line, buy when MACD goes above the trigger line.
- Momentum (MTM)
Measures price change over a given time period.
- Money Flow Index (MFI)
momentum indicator showing strength of money flowing into and out of a stock. If price trends higher and MFI lower (or vice versa), a reversal may follow. Stock likely to be at the top when MFI is greater than 80 and bottom when MFI is less than 20.
- Negative Volume Index (NVI)
Attempts to identify bull markets on the theory that when volumes increase uninformed investors are following like sheep, while when volumes are lower informed investors are at work. Thus is shows what the informed investors are doing. In Stock Market Logic, Norman Fosback points out that the odds of a bull market are 95 out of 100 when the NVI rises above its one-year moving average. The odds of a bull market are roughly 50/50 when the NVI is below its one-year average.
- On Balance Volume (OBV)
Momentum indicator relating volume to price moves. If the stock ends up, volume total is added to the cumulative total, if stock ends down days volume is subtracted. Rising OBV is a sign of informed investors buying.
- Positive Volume Index (PVI)
Opposite of the NVI. Shows what un-informed investors are doing. When PVI is above its moving average indicates bull market, bear market when below.
- Price Oscillatorr (POS)
Shows variation between moving averages.
- Price and Volume Trend (PVT)
Momentum indicator relating volume to price moves (similar to OBV), but adding or subtracting only a percentage of the days volume (using the % move up or down). Thus it seems to be a more accurate reflection than OBV. Look for PVT trending higher while prices trend lower. A strong price increase could follow.
- Rate of Change (ROC)
Percentage difference between current price and price x days ago. The default here is to show both the 5 day and 9 day ROC. As prices increase, the ROC rises and as prices fall, the ROC falls. The greater the change in prices, the greater the change in the ROC.
- Relative Strength Index (RSI)
Price oscillator that ranges between 0 and 100. Divergence with the price is used to hint for a reversal. Default is to show a 14 day RSI, drawing a line at 30 and 70 as RSI usually tops above 70 and bottoms below 30.
- Simple Moving Average (SMA1,
SMA2, SMA3)
Average price over x days. Investors typically buy when a security's price rises above its moving average and sell when the price falls below its moving average.
- Stochastic (STS)
Display as 2 lines, the orange line (called %D) is a moving average of the main blue line (called %K). Buy when either %K or %D falls below 20 and then rises back above that level. Similarly, sell when the either line rises above 80 and then falls back below. Another pattern to look for when timing trades is buy when the %K line rises above the %D line or sell when the %K line falls below the %D line. Be on the lookout for divergences, if prices are making a series of new highs and the Stochastic Oscillator fails to surpass its previous highs, the indicator typically will provide the clue as to where prices will soon head.
- Trend Deviation (TRD)
- TRIX Index (Trix)
TRIX is a momentum indicator that displays the percent rate-of-change of a triple exponentially smoothed moving average of the security's closing price. It is designed to keep you in trends equal to or shorter than the number of periods you specify. TRIX crossing above the zero line is a potential buy signal and a closing below the zero line is a potential sell signal. Divergence between price and TRIX can also indicate significant turning points in the market.
- Ultimate Oscillator (ULT)
Uses weighted sums of three oscillators, each of which uses a different time period expressed as a single line plotted between 0 and 100, with oversold territory below 30 and overbought territory above 70.
- Volatility Ratio (VLT)
- Volume Oscillator (VOS)
Uses the difference between two moving averages of volume to determine if the overall volume trend is increasing or decreasing.
- Williams Accumulation Distribution (WAD1)
Used to determine if the marketplace is controlled by buyers (accumulation) or by sellers (distribution). Williams recommends trading this indicator based on divergences: Distribution of the security is indicated when the security is making a new high and the A/D indicator is failing to make a new high. Accumulation of the security is indicated when the security is making a new low and the A/D indicator is failing to make a new low.
- Williams %R (%R)
Momentum indicator that measures overbought/oversold levels. -80 to -100% indicate that the security is oversold while values in the 0 to -20% range suggest that it is overbought. An interesting phenomena of the %R indicator is its uncanny ability to anticipate a reversal in the underlying security's price. The indicator almost always forms a peak and turns down a few days before the security's price peaks and turns down. Likewise, %R usually creates a trough and turns up a few days before the security's price turns up.
|