Cycle Trends 4 R5495 + R395 / month


Cycle Trends LIVE R4395 + from R980 / month

OVERVIEW
FEATURES
WHY BUY?
LEARN HOW
MORE INFO
REQUEST TRIAL
SIGN UP
MENU
  • OVERVIEW
  • FEATURES
  • WHY BUY?
  • LEARN HOW
  • MORE INFO
  • REQUEST TRIAL
  • SIGN UP

Cycle Trends is a unique software package that identifies investment opportunities by analysing market cycles

By finding market highs, lows and the resultant trends, cycle analysis has the potential to reward you with handsome profits!


CYCLE TRENDS 4

The Cycle and Technical Analysis Software for the 21st Century Investor! The new features in Cycle Trends 4 will greatly enhance your experience when analysing the markets.

The function of the SuperScan is to scan any supported shares database and filter out the stocks or shares that are giving buying or selling opportunities.

In addition to the SuperScan there is an enhanced WatchList which incorporates the scan signals from the SuperScan which means you can now see at a glance how the shares you are watching are performing.

You can open a chart for any share in the SuperScan or the WatchList by simply double-clicking on the share.

SuperScan results can also be saved as a WatchList so that you can keep an eye on promising shares.

Share data can also be compressed which allows you to view a chart of a share with Weekly, Monthly, Bi-Monthly, Quarterly or even Yearly data points instead of the default Daily data points.

If you haven't upgraded your license yet take a look at the video demonstration of the SuperScan further down the page to see why so many Cycle Trends users have already upgraded.

The New SuperScan

The new SuperScan functionality is now available in Cycle Trends 4 and demonstrates the theory and practical use of the SuperScan. There are five parts to this tutorial, namely:

  • The Theory Behind the Scan
  • Steps to See the Scan
  • SuperScan Options
  • Backing Up (Confirming) Scan Results
  • Using SuperScan in Practice

CYCLE TRENDS LIVE

Cycle Trends Live is here and its forecasting capabilities are simply astonishing. The software is perfect for forex traders and CFD/equity traders alike who are dealing on an intraday basis and need real-time data to execute their market orders.

The software comes with 7 tutorial discs that explain how to optimize results using the unique program and how to generate profits using several trading strategies.

Cycle Trends Live uses Cycles and Technical Analysis to analyze and forecast Financial Markets in Real Time. The software supports live intraday data provided by Sharenet.

Cycle Trends Live is an invaluable aid to profitable investment. It works equally well with all the different components of the financial markets, including US and international equities, indices, commodities, precious metals, gilts, currencies, funds and futures.

Identify investment opportunities with ease.

Forecast market tops and bottoms.

Forecast trend reversals.

Works with equities, indexes, bonds, futures, commodities, currencies, funds etc.

2 versions, Version 4 (End of day feed) and Live (Real-time feed)


Indicators

Indicators are divided into cycle and standard indicators.

Cycle indicators include:

  • Trigonometric and Array cycles, giving analysts the option of using two cycle techniques.
  • Trendic - a cycle indicator to confirm changes in trend.
  • An overbought/oversold indicator also based on cycles, which has proved exceptionally useful in pointing out stocks that have fallen too far and are showing value.

Standard indicators include:

  • Moving Averages
  • RSI
  • Stochastics
  • Relative Strength
  • Onbalance Volume - combined with an oscillator to point to break outs in price before they occur.
  • Trend Lines - showing supports and resistance levels.

Special Program Features

  • A cycle scan that highlights stocks and other financial instruments at the top and bottom of cycles.
  • Own List - a feature that allows the analyst a set portfolio of shares, moving from stock to stock by using the arrow keys. Set indicators are maintained.
  • Analysts will be able to put in an intraday price and so not have to wait for an end of day price.

About Cycle Trends

Cycle Trends, is a unique software package based on cycles and technical analysis. The program identifies powerful opportunities for investment and trading because of its ability to forecast tops, bottoms and trend reversals. This applies to the different components of the financial markets, including equities, indexes, bonds, futures, commodities, currencies, funds etc.


The Magic of Cycles

Just as one can predict the future in natural events such as the seasons, bird migrations, the tides, moon cycles and human activity (hormonal cycles), it has been proved that there are stock market and business cycles. Many economists, such as Kondratief (the 54-year cycle), became famous for finding specific cycles in business activity.


The Cycle Trends Approach

The Cycle Trends program differs from traditional wave and Cycle Theories (e.g. Elliot Wave and Gann) because it does not begin with a pre-existing framework into which the data must be squeezed, but rather it begins with the raw data and searches for whatever cycles are actually there.

Using modern statistical techniques such as Fourier transforms, trigonometric regression and array analysis, the program searches for cycles within the data stream, of the stock or financial instrument under analysis, establishing their strength and reliability as a predictive tool.

The mathematics are scary but the results are impressive. On average 20 cycles are isolated and then combined and projected into the future. The program is able to compute the large cycles that forecasts major tops and lows, and the smaller cycles that call the corrections that take place with the major trend.


'Forex Trading - The Successful Way'

A hands-on demonstration of how to use Cycle Trends to trade Forex. BOOK the workshop or BUY the video download.

BUY VIDEO DOWNLOAD >

Want to learn how to trade Forex? Want to start trading as soon as possible? Can't wait for our next Forex workshop? Then we'd recommend purchasing the video recording of our 'Forex Trading - The Successful Way' seminar.

This is a live recording of the workshop with Joz Britz where he take you step-by-step through the process of trading Forex using Cycle Trends. This video is the perfect way to learn how to trade Forex in your own time and at your own pace.

To find out what is covered in the video, please see the course outline below.

Attend our Forex Trading Workshop

'Forex Trading - The Successful Way' has been designed with the objective of teaching you the theory and techniques of using cycle and technical analysis to trade forex successfully.

By the end of the course, you will have learnt how to use Cycle Trends in conjunction with Joz's hard-won and first-hand trading rules to trade forex successfully.

Joz will tell you that trading forex can be a good income stream if the rules of cycle analysis and money-management are followed with discipline.

Course Outline

  • What is forex?
  • Learn the basics and how to trade forex
  • What is a pip and why is it important?
  • Cycle theory and techniques
  • Using the Trendic indicator
  • Understanding candlesticks
  • How to use a trading platform
  • Using the TrueOBOS Indicator
  • Break-out trading techniques
  • Exiting from a trade
  • Stop-loss techniques
  • Money management
  • Trading strategies
  • Trading in channels

You can book your seat online now by clicking the button below, or if you'd like to speak to us in person you are welcome to phone us on (021) 700 4800 or us at email workshop@sharenet.co.za

  • Refreshments served on the day.
  • Directions and details will be sent to you before the course.

BOOK YOUR SEAT HERE >

About Joz Britz

Ever met a forex trader that doesn't like to talk about all the money he's making? Well, meet Joz Britz, a refreshingly honest and down-to-earth guy that very seldom wears a suit or tie but who is as professional as they come. It's been a few years now since Joz was a workshop attendee like you but in that time he's come a long way.

Joz will tell you it's been a journey but that in that time he learnt some invaluable rules of the game. The first being, "DON'T LOSE MONEY", the second being, "DISCIPLINE".

During the workshop Joz will share his clear, easy-to-understand insights and demonstrate how he's been able to grow his initial starting capital close on 100 times. As he always likes to say, "If I can learn how to trade forex, anyone can."

Cycle Analysis and Indicators

What are Cycles?

A regular cycle is the regular occurrence of an event at specified times and of a specified size. An example of such a cycle is the rotation of the earth around the sun on a regular 365.25-day basis i.e. at -23.5 degree latitude (the Southern Hemisphere) the sun will always be directly overhead (no shadow) at 12h00 noon on the 21st of December. Another regular cycle is the 24-hour rotation of the earth around its own axis.

Mathematically speaking a regular cycle will have a constant size (amplitude) and the time-interval from low to low and from high to high (period) will always be the same. In between highs and lows, the variation of the size with time is described by a sine or cosine (very smooth) curve.

In economic time series, such as the price movement of a share with time, one can hardly hope for such regular cycles. If the cycles were indeed so regular, everybody would have been able to spot them and there would have been no markets for these instruments. Here the movement will be much more erratic i.e. both the amplitude and the period will vary with time.

The purpose of a cycles program, such as Cycle Trends, is to find these irregular or erratic cycles in the history of a financial instrument and to project them forward in time with a sufficient measure of certainty to be useable for profitable trading or investment.


History of Cycle Analysis

Probably the first well-documented use of cycles appeared in the Bible when Joseph, while in jail in Egypt, figured out that the Nile River has a 14-year cycle of floods and droughts. This made him the second most powerful man in the world of his time.

When primitive societies started to change from hunting and gathering to agriculture, around 10 millennia ago, the seasons had to be studied to determine the ideal time for planting. Stonehenge probably served as an early attempt at such a venture, but many such sites existed in the ancient world.

The next big impetus for cycles came after the Industrial Revolution when it was realised that economic prosperity is not a smooth process but moves in cycles. A General Leonard P Ayres expressed it very well when he said:

"Business cycles are as old as the industrial era. Their prosperities have created thousands of fortunes and their depressions have made millions of workers hungry and desperate. They have overturned governments, fomented revolutions, and caused wars. They are our most serious political problem."

The origin of the theory of business cycles may be traced back to a paper by a Swiss historian, JCL de Sismondi, in 1819. After that many economists, such as Juglar, Kitchin, Kondratieff and Jevons became famous for finding specific cycles in business activity.

In 1801, the celebrated astronomer Sir William Herschel, in a paper read before the Royal Society, drew attention to an apparent relationship between sunspot activity and the price of wheat. When sunspots were high, wheat grew abundantly and vice-versa. This proved to be one of the most successful forecasts of the 19th century.

In 1940 ER Dewey set up the Foundation for the Study of Cycles in Pittsburg. Since then this foundation became the leading body of cycle studies in the world. They have identified cycles in thousands of events ranging from geese populations to silt deposits in lakes to long term cycles in the Dow Jones Index and the prices of gold and wheat.


Indicators of Cycle Analysis

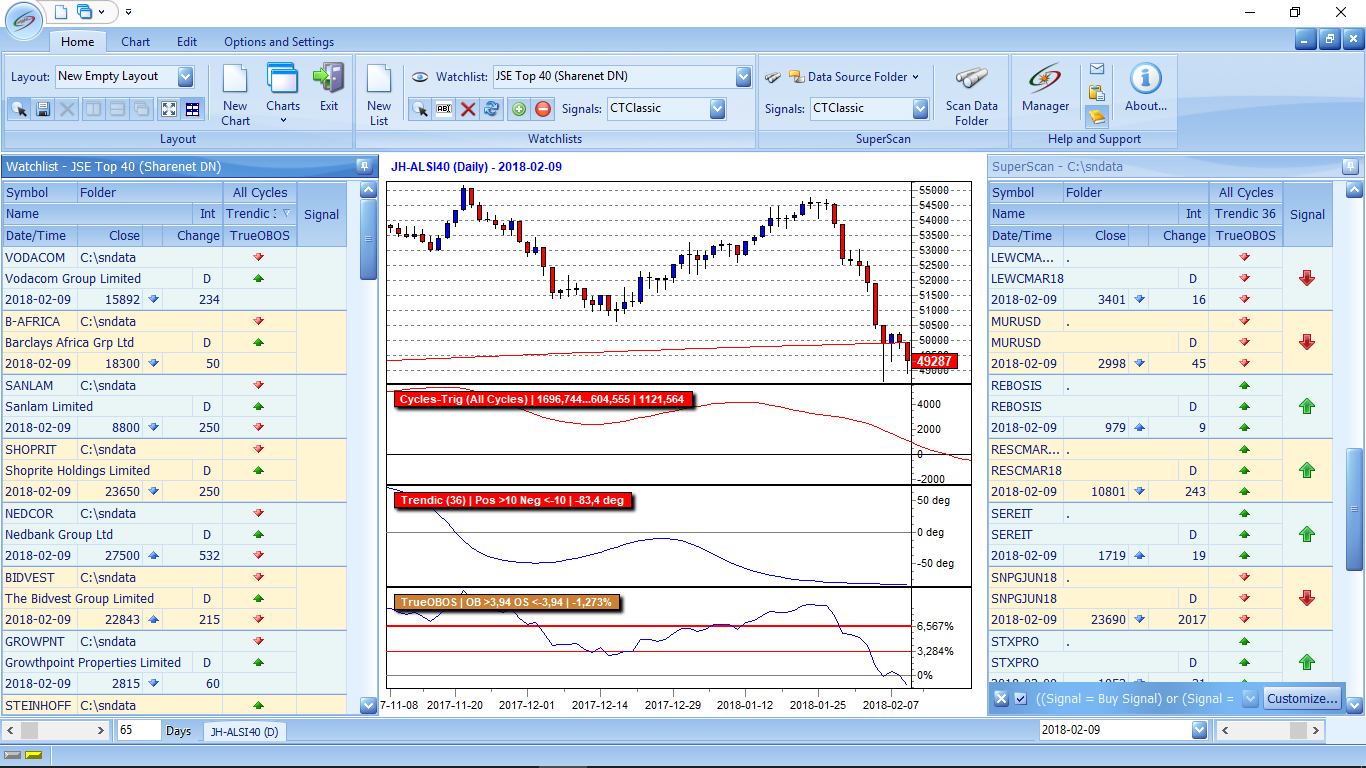
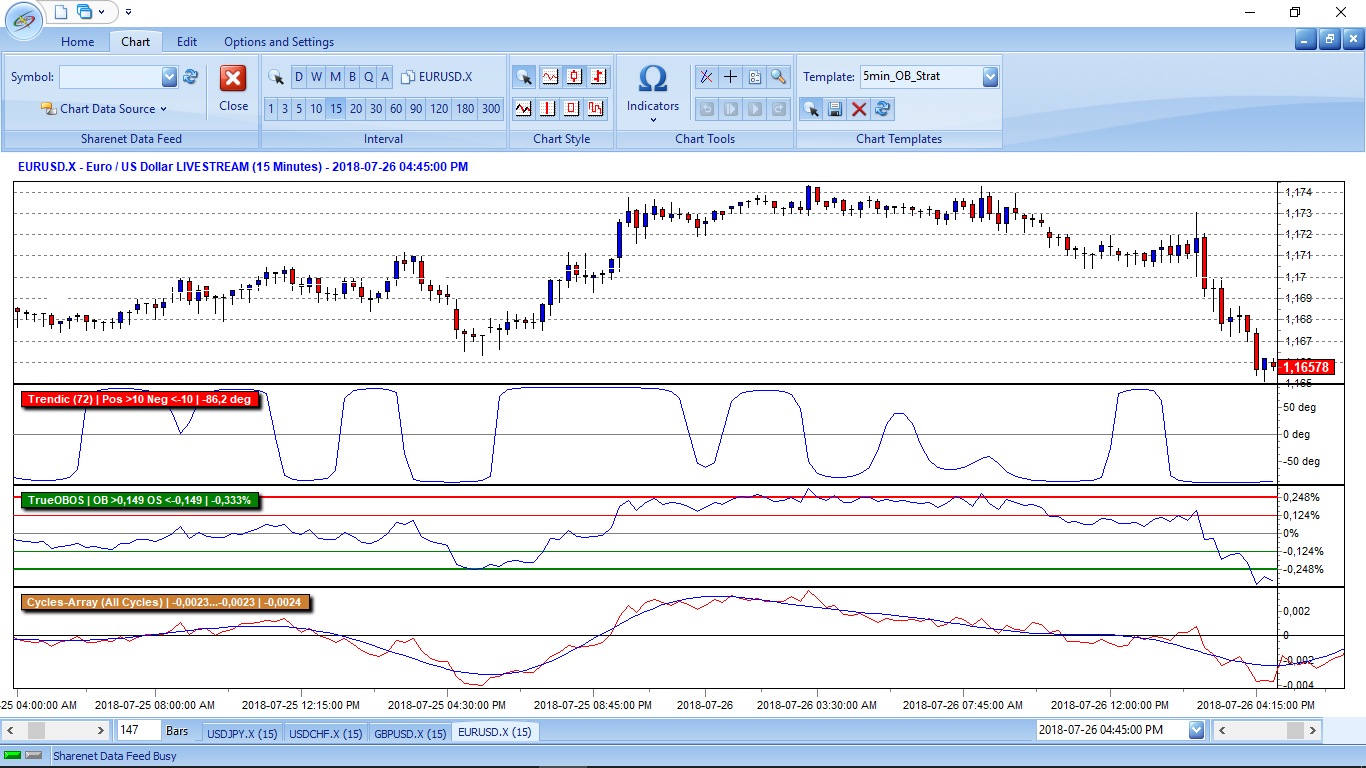
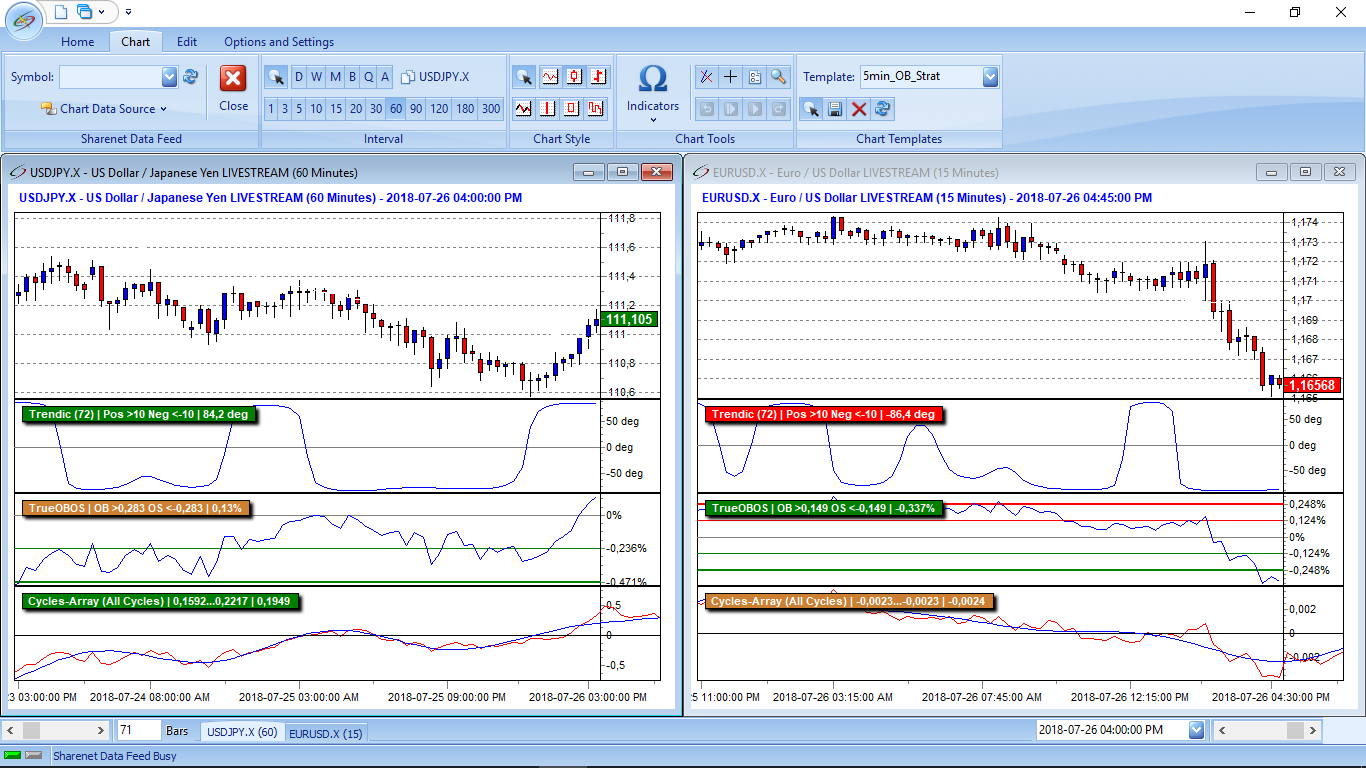
Cycle Trends uses four specialized indicators for performing cycle analysis: Cycles-trig, Cycles-array, Trendic, and TrueOBOS. These indicators are not based on standard methods of technical analysis, but rather on the mathematical/engineering methods of digital signal processing.

These methods can only be applied to a stationary series i.e. a de-trended time series. To de-trend the series a Fourier filter is used (represented by the blue line in the Cycle-Trends price graph window). There are many advantages to the Fourier filter such as that it does not loose end points as a centered moving average filter would do.

The Fourier filter is basically a regression method, meaning that history changes as you move on in time, deleting old data and adding new data. The displayed shape of the blue line on the price graph may therefore change from day to day and this makes it strange for new users. One has to use the go-back facility to evaluate the cycle indicators at a specific point in the history.

To obtain the Cycles-trig indicator cycles of a specific shape viz a sinusoidal shape is fitted via trigonometric regression. The best ones are chosen by the the program and the user can combine them in any way.

To obtain the Cycles-array indicator the cycles may be of any shape from square to triangular to sinusoidal. Once again the best ones are chosen by the program and the user can combine them.

The TrueOBOS measures the deviation from the Fourier trend (the blue line) in a very special and statiscally sound way. Instead of using the standard deviation, which is tied to the Gaussian distribution, it uses the Mean Absolute Percentage Deviation (MAPD) to measure the deviation. The MAPD is non-parametric i.e. distribution free and therefore statistically more sensible. Oversold/overbought levels are described in terms of the MAPD say between one and two.

Trendic has a slightly different flavour. Here the proper Fourier cycles are used. One cannot use Fourier cycles for prediction because the series just ends where it started, it is circular, therefore Trendic is not extended into the future. To enable trendic as a forecasting tool the slope of the series is used. When the slope turns from negative to positive a bottom in the the series was reached and vice versa. In a sense this is not forecasting but confirmation, hence its advocated use.

Request a Cycle Trends trial


Register

We want to get to know you

* Required Fields

Cycle Trends 4

Cycle Trends Live